
This is Part 3 — the finale — of Decoding Your SSVI Score, the series where we take CMS’s new hospice score apart one piece at a time. Part 1 covered non-hospice spending and Part 2 covered the eight utilization measures. Now we put both halves back together.
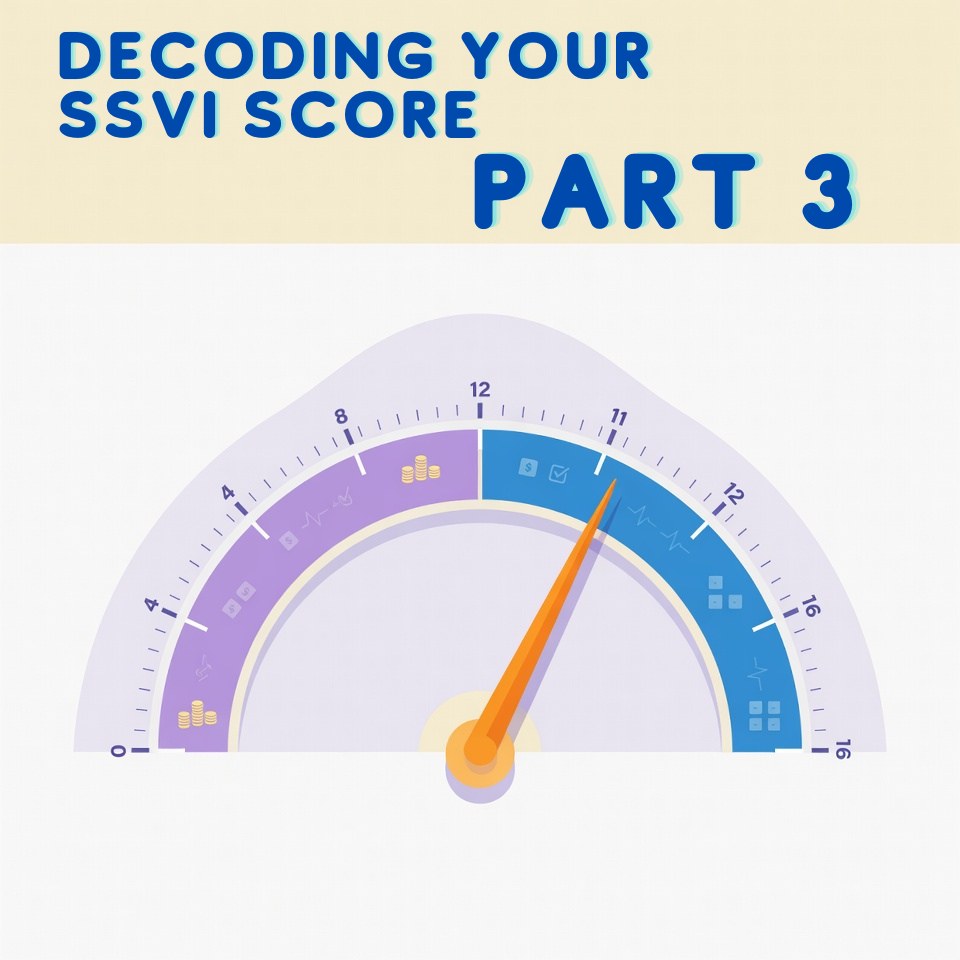
You’ve seen both halves. The Non-Hospice Spending Score is the dollar half; the Utilization Score is the care-pattern half. This post is about the number they add up to — your total SSVI, 0 to 16 — what a “good” one actually looks like, and why the total alone is the least useful thing about your score.
New here? Start with our overview, CMS Built a New Score That Flags Your Hospice for Oversight, then look up your own score free.
How the Two Halves Combine
The math is deliberately simple:
Non-Hospice Spending Score (0–8) + Utilization Score (0–8) = Total SSVI (0–16)
That’s it — the total is just the sum. But the important property isn’t the addition, it’s that the two halves are independent. They measure different things from different data: one is a single dollar ranking, the other is eight separate care-pattern tripwires. Nothing about a high spending score makes your utilization score go up, or vice versa. You can max one and score zero on the other.
Which leads to the single most important idea in this whole series: the total tells you almost nothing on its own. Two hospices sitting at the same total can be opposite kinds of operations with opposite problems.
What Is a Good or Average SSVI Score?
Lower is better — a 0 means you’re close to CMS’s target range on everything, a 16 means you’re an outlier on everything. But “is my score high?” only means something against the real distribution. Here’s where the roughly 6,600 hospices CMS scored for FY2025 actually landed:
- The median total SSVI is about 6. Half of all hospices score 6 or lower.
- Most hospices cluster between 4 and 9 — that band alone is roughly three-quarters of the field.
- About a quarter score 4 or lower. That’s genuinely good.
- Only about 12% score 10 or higher, and only about 3% (roughly 196 hospices) score 12 or higher.
- The very top is thin: just one hospice in the country scored a 15, and none scored a 16.
So if you’re in the low single digits, you’re in good company. If you’re at 10 or above, you’re in the tail CMS built this index to find — not an accusation, but a flag. Here’s the full FY2025 distribution:
| Total SSVI | Hospices | Share |
|---|---|---|
| 0 | 4 | 0.1% |
| 1 | 87 | 1.3% |
| 2 | 332 | 5.0% |
| 3 | 527 | 7.9% |
| 4 | 714 | 10.7% |
| 5 | 887 | 13.4% |
| 6 — median | 890 | 13.4% |
| 7 | 898 | 13.5% |
| 8 | 899 | 13.5% |
| 9 | 571 | 8.6% |
| 10 | 407 | 6.1% |
| 11 | 230 | 3.5% |
| 12 | 122 | 1.8% |
| 13 | 55 | 0.8% |
| 14 | 18 | 0.3% |
| 15 | 1 | 0.0% |
| 16 | 0 | 0.0% |
FY2025 distribution from CMS’s published SSVI overview document, n = 6,642 scored hospices. Shares are rounded and may not total 100%.
CDPH Emergency Regulation Changes — Live Q&A This Wednesday at 10:00 AM Pacific
Wednesday, October 14 · 40 minutes · Hosted by Miles Pickens, Hospice Engine
Bring your questions on CDPH’s emergency hospice licensing regulations (Title 22) — nurse ratios, management qualifications, CHOW, and the licensing moratorium. Zoom link sent by email when you register. The first 3 seats each Wednesday session are free.
Same Total, Different Hospice
This is why the breakdown matters more than the number. Picture two hospices that both score a total of 8 — right around the middle of the pack:
- Hospice A — 8 + 0. An 8 on non-hospice spending, a 0 on utilization. Its care patterns are clean — it visits, it uses the full benefit, its discharges look normal — but Medicare is spending heavily around its patients. Its entire problem is on the dollar side: relatedness decisions, the Election Statement Addendum, Part D leakage. The fixes in Part 1 are its whole to-do list.
- Hospice B — 0 + 8. A 0 on spending, an 8 on utilization. No outside dollars at all — but it’s tripping every care-pattern measure: thin visits, no crisis care, long-stay concentration, high live discharges. Spending fixes would do nothing for it. The visit-intensity and discharge work in Part 2 is its whole list.
Same total. Opposite operations. Opposite fixes. Anyone who reacts to the 8 without opening it up is working blind — which is exactly why your next step isn’t to memorize your total, it’s to read your breakdown.
How to Read Your Own Breakdown
CMS didn’t just publish the composite — it published which bracket and which measures sit underneath every hospice’s score, for both FY2024 and FY2025. We put that behind the free lookup so you don’t have to dig through the spreadsheet. Search your hospice and click “Where do these points come from?” and you’ll see:
- Your non-hospice spending bracket — which of the eight dollar groups you fell into, and the points it earned.
- All eight utilization measures as a checklist — flagged or clear, each with your hospice’s value next to the exact CMS threshold for that year, so you see how close each one was.
Read it in one specific order. First, find which half is bigger — that’s where the points are, and where your effort belongs. Then, within that half, find the borderline items — a measure that flagged by a tenth of a percent is far easier to move than one you’re deep into. That’s how you turn a 0-to-16 number into a short, prioritized worklist. (More on the breakdown view in our announcement of the feature.)
See Your Full Breakdown — Free
Search your hospice, then click “Where do these points come from?” to see your spending bracket and all eight utilization measures, for FY2024 and FY2025.
Look Up Your SSVI Score →What a High Total Actually Triggers
It’s worth repeating as we close the series: a high SSVI is not a finding of fraud, waste, or abuse, and it doesn’t change your payment rate. CMS is explicit about that. What it does is sort — it’s a transparency-and-targeting tool. When the next wave of medical review, education, or enhanced oversight gets aimed, a hospice sitting at 12 with multiple tripwires lit is a more obvious place to look than one sitting at 4. The score doesn’t punish you; it decides where the attention goes. Knowing yours — and being able to explain every point of it — is the whole advantage.
And remember the SSVI is still part of a proposed rule (CMS-1851-P). The thresholds and even the methodology could change before anything is final. But the underlying behaviors it measures — spending, visits, length of stay, discharges — are the same ones every other hospice enforcement tool already watches. Working on them is never wasted.
Want Someone to Read It With You?
Our $400 SSVI Action Plan is a focused 1-hour session where we pull your component breakdown, identify which half — and which specific measures — are driving your total, and map the prioritized fixes that move it. The same data work behind our Qlarant rebuttals, applied before a letter ever arrives.
Book Your SSVI Action PlanThe Full Series
- CMS Built a New Score That Flags Your Hospice for Oversight: Meet the SSVI — the overview.
- Part 1: Non-Hospice Spending — the dollar half.
- Part 2: The Utilization Score — the eight care-pattern measures.
- Part 3: Putting It Together — you’re here.
- See Your Score Breakdown — the free lookup, now with the point-by-point view.
Disclaimer: The SSVI is part of CMS’s FY2027 Hospice Wage Index proposed rule (CMS-1851-P) and is not finalized; the comment period closed June 1, 2026, and the methodology or thresholds could change. The distribution and figures above are from CMS’s published Service and Spending Variation Index files for FY2024 and FY2025. This article is informational and not legal or compliance advice; verify against the CMS source and your own counsel before acting.